Note
Click here to download the full example code
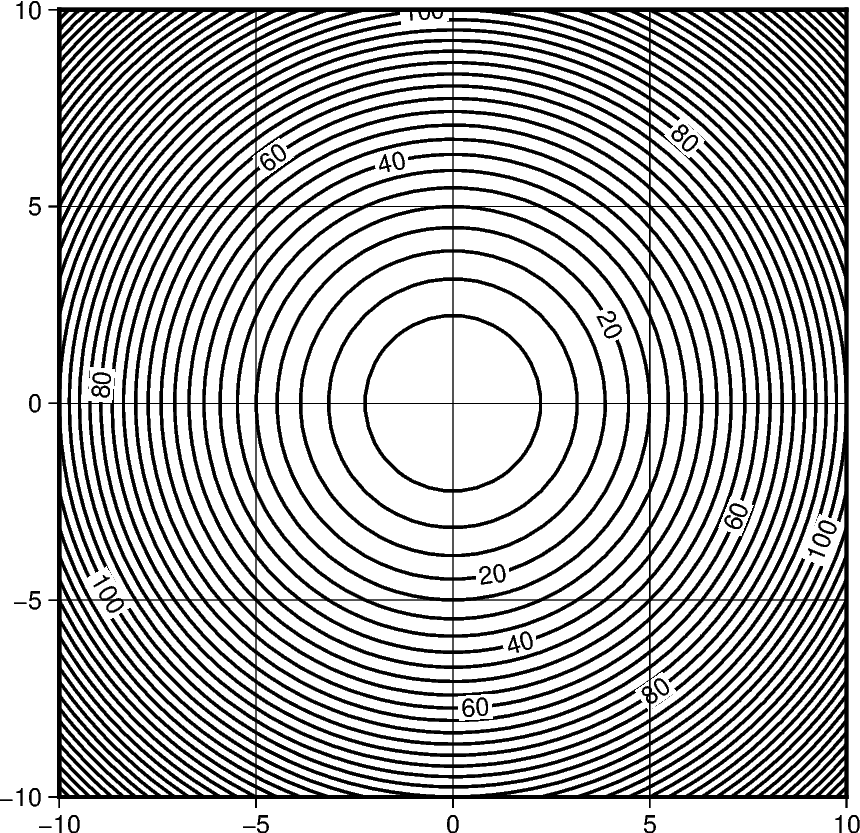
Contours
The pygmt.Figure.contour method can plot contour lines from a table of points by direct triangulation.
The data to the triangulation can by provided in one of three options:
1:
x,y,z1d data columns 2:data2d data matrix with 3 columns corresponding tox,y,z3: ‘’data’’ path string to a file containing thex,y,zin a tabular format
The parameters levels and annotation are deciding on the contours intervals and intervals of the
annotation on the contours
Out:
<IPython.core.display.Image object>
import numpy as np
import pygmt

X, Y = np.meshgrid(np.linspace(-10, 10, 50), np.linspace(-10, 10, 50))
Z = X**2 + Y**2
x, y, z = X.flatten(), Y.flatten(), Z.flatten()


fig = pygmt.Figure()
fig.contour(
    region=[-10, 10, -10, 10],
    projection="X10c/10c",
    frame="ag",
    x=x,
    y=y,
    z=z,
    levels=5,
    annotation=20,
    pen=1
)
fig.show()
Total running time of the script: ( 0 minutes 1.060 seconds)